Wave Project
Documentary
Rube Goldberg Project
Our Rube Goldberg's goal was to drop a tea bag into a cup of hot water. The calculations and steps of our Rube Goldberg are below.
The Rube Goldberg Video is below.
Technology Project
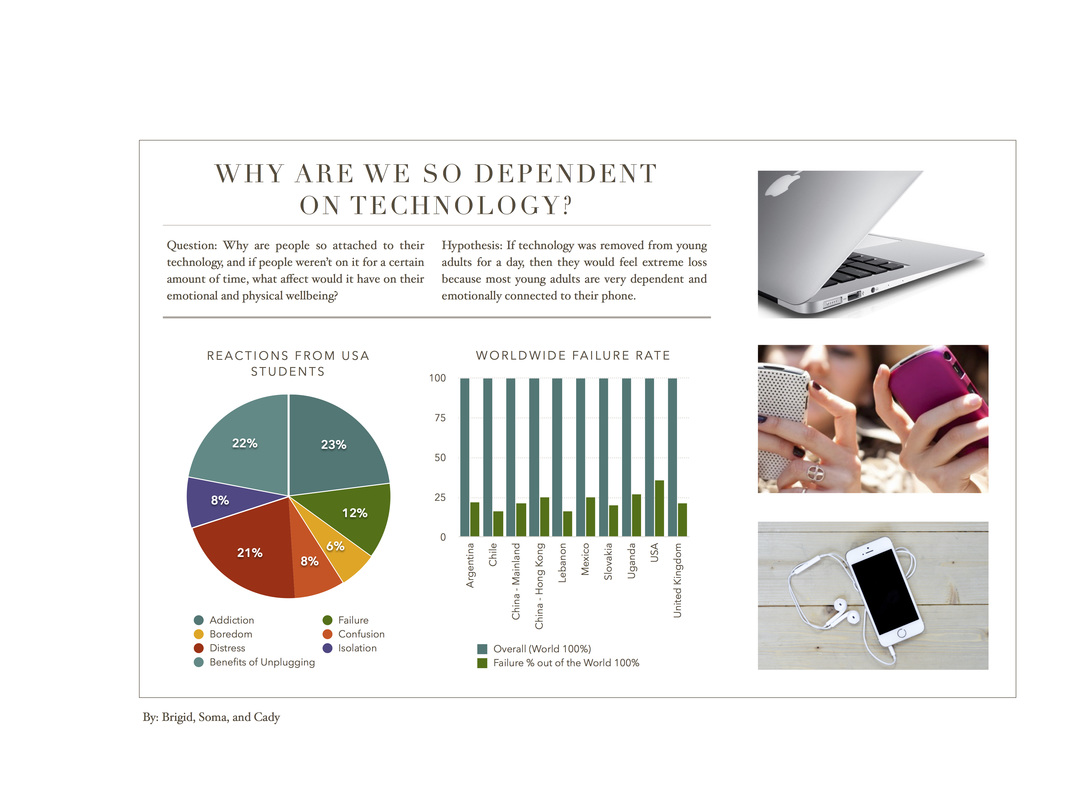
The purpose of this project was to focus on the age group of teens and how the use of technology may be positively or negatively affecting them. The main question we wanted to answer was how does technology affect us; our well being, safety, health, ability to learn and development? Carrying out this project our goals were to learn these skills: apply the Scientific Flowchart to investigate ideas we find interesting, develop testable scientific questions, identify reliable sources of information while performing independent research, go pro at spreadsheets: interpret and analyze large sets of data, and communicate our ideas to a public audience with a desired outcome in mind. Each group or person in the class had the choice to choose what type of project they would like to do, including: reviewing and taking notes on scientific studies, a survey of a large group of people at Animas, and an experiment. After each student chose that, they needed to come up with an original question to answer to carry out the project. After this, we needed to choose a finishing product, either an info-graphic, and infomercial, a formal report, a public service announcement, or a creative new idea.
My group consisted of three people, myself, Soma Smith, and Cady Bright. We decided to do a literature review, with our end product being an info-graphic. The question we answered was: Why are we so attached to our technology? If we didn’t use social media in our free time and instead “spaced out,” or “daydreamed,” would we feel more energetic and would we feel more stimulated at the end of the day, physically and mentally? Doing this project, I have shown the most growth in is learning how to formulate proper scientific hypotheses and questions (see document below) and learning more of how to use Google Excel. I can make equations for the program to do and make graphs with customization.
Below is the Project Report and our Final Info-graphic Product.